 pick a feature
How to Prioritize Feature Requests (RICE, Kano & More)
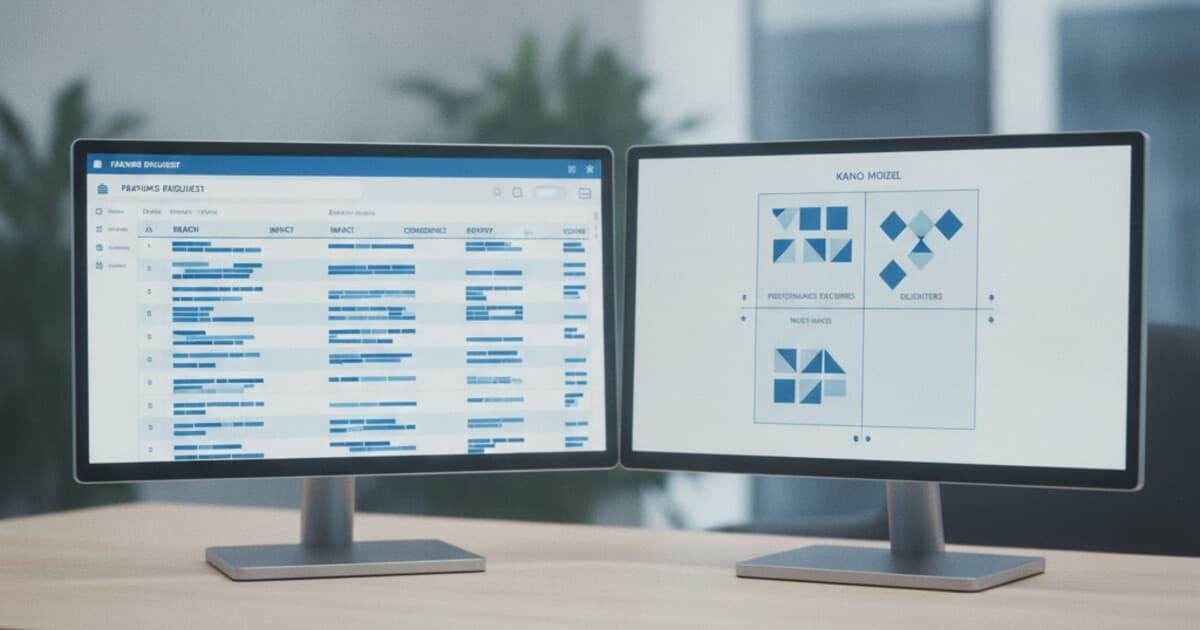
Your feature request backlog is probably longer than your shipping capacity, and that gap only grows. Users want dark mode, offline sync, CSV export, and half a dozen other things, and somehow they want it all yesterday.
Collecting requests is the easy part. Knowing which ones to build is where most teams stumble. Build the wrong thing and you've burned weeks on a feature used by 8% of your users. Build the right thing and you ship something that cuts churn or drives upgrades.
The difference between those outcomes is how you prioritize feature requests.
To prioritize feature requests, score each one by reach (how many users benefit), impact (how much it moves the needle), confidence in your estimates, and effort required. Divide those three by effort to get a RICE score. Sort high to low, then use the Kano model as a second filter to separate must-haves from nice-to-haves.
Why Vote Count Alone Won't Give You the Answer
Voting is a useful signal, but a poor decision-maker on its own.
Feature voting captures who's vocal, not necessarily who's representative. Your top 5% of power users vote on everything. That's useful data, but they may use your product in ways that 80% of your audience never will.
Users also ask for symptoms, not cures. "Add a calendar view" often means "help me track progress over time." Building the literal request sometimes misses the underlying job.
Vote count also ignores the cost side of the equation. A 10-vote feature that ships in two days can deliver more value per hour than a 100-vote feature that takes three months.
Feature prioritization is one of the highest-leverage decisions in product development. The RICE framework, created by Intercom's growth team, gives every team a shared scoring language: Reach (users affected per quarter), Impact (on a 0.25 to 3 scale), Confidence (percentage certainty in your estimates), and Effort (in person-months). A feature with Reach=200, Impact=2, Confidence=80%, and Effort=0.5 months scores 640. A feature with 500 votes but 4 months of work scores 125. Build the first one first. Layering in Noriaki Kano's 1984 model adds a second dimension: not just which feature to build, but what kind of value it creates. Must-have features keep users from churning. Performance features drive satisfaction in proportion to how good they are. Delighters earn loyalty without users ever asking for them. Used together, RICE and Kano answer both "what's worth building next?" and "how much does it matter to retention?"
The RICE Scoring Method for Feature Requests
RICE stands for Reach, Impact, Confidence, and Effort. Intercom's product team published it as a way to stop debating opinions and start comparing numbers.
The formula: Score = (Reach × Impact × Confidence) / Effort
Here's what each factor means.
Reach is how many users this feature affects per quarter. Pull it from analytics or your vote count. If 200 of your 1,000 monthly active users requested dark mode, Reach = 200.
Impact is how much it moves the needle per user. Use this scale: 3 for massive impact, 2 for high, 1 for medium, 0.5 for low, 0.25 for minimal. Yes, it's subjective. The point is to force a number so you can compare requests on the same axis.
Confidence is how certain you are about your Reach and Impact estimates. Express as a percentage: 100% means you have hard data, 80% means you've validated it but not exhaustively, 50% means you're guessing. Low confidence shrinks the score appropriately.
Effort is person-months of work. A 2-day task is roughly 0.1. A 2-month feature is 2.
Here's how two competing requests might score:
- Dark mode: Reach=200, Impact=1 (nice, doesn't affect core workflow), Confidence=90%, Effort=0.3 → Score = (200 × 1 × 0.9) / 0.3 = 600
- CSV export: Reach=80, Impact=2 (unblocks a key workflow), Confidence=80%, Effort=0.5 → Score = (80 × 2 × 0.8) / 0.5 = 256
Dark mode wins despite lower per-user Impact because Reach and low Effort tip the math. RICE surfaces that trade-off instead of leaving it to intuition.
You can run RICE in a spreadsheet. Six columns: feature name, Reach, Impact, Confidence, Effort, Score. Sort descending by Score. Done.
The Kano Model: Sort Features by the Value They Create
RICE tells you what's worth building. The Kano model tells you what kind of value each feature creates.
Noriaki Kano published his model in 1984, and it holds up because it maps to how users actually experience product quality. There are five categories.
Must-haves are basic expectations. When absent, users are upset. When present, nobody notices because it's table stakes. For a feature-request tool, users expect to be able to submit a request at all. That's a Must-have.
Performance features scale linearly with user satisfaction. More speed, more storage, more request slots: every increment helps. These are the core value drivers.
Delighters are unexpected features that create positive surprise. Users didn't ask for them, so their absence doesn't hurt. Their presence earns loyalty and word-of-mouth.
Indifferent features get no reaction either way. Build these last, or skip them.
Reverse features actively annoy some users. Worth knowing before you ship.
To categorize a request using Kano, ask users two questions:
- "How would you feel if this feature was present?" (Delighted / Expected / Neutral / Can live without / Dislike)
- "How would you feel if this feature was absent?" (same scale)
The pattern of answers places each feature in a category. A survey of 10 to 20 users gives you enough directional data to work with.
In practice: ship Must-haves first (table stakes), grind on high-RICE Performance features for retention, and layer in Delighters once the core is stable.
A Practical Prioritization Workflow for Small Teams
You don't need a complicated process. Here's what works at the indie and small-team scale.
Step 1: Collect with context. Log every request with who asked, how many others seconded it (votes), and what job they're trying to get done. If you're already collecting feature requests systematically, this data is already there. If not, start there first.
Step 2: Triage out-of-scope requests. Filter out requests that are outside your current focus, require dependencies you don't have, or conflict with your product direction. This keeps your RICE sheet clean and focused.
Step 3: Score with RICE. Spend 5 to 10 minutes per request on Reach, Impact, Confidence, and Effort. A spreadsheet works fine. The goal is a ranking that's better than gut feel, not a perfect mathematical answer.
Step 4: Label the Kano category. For your top 10 to 15 scored items, label each one. A high-RICE Must-have goes to the top of the queue. A high-RICE Delighter goes later, after the core product is stable.
Step 5: Group into quarters. Slot your top items into 90-day buckets. Keep next quarter tight and committed. Let future quarters stay loose. Overcommitting kills morale and credibility.
Step 6: Review monthly. User needs shift. Vote counts climb on new requests. Competitors ship features that change what counts as table stakes. A lightweight monthly review keeps your list current without requiring a full rescore every time.
How pick a feature Helps You Prioritize
Feature request voting inside your app gives you Reach data without guesswork. When users vote on requests in pick a feature, you see exactly how many active users want something: that's your RICE Reach input, sourced directly from your user base.
The comment threads give you the qualitative layer. Users often explain why they want something, which feeds your Impact and Confidence estimates. A request with 30 votes and 8 comments saying "this is blocking us from upgrading" scores very differently than 30 votes with no context attached.
The status workflow (pending, under review, approved, in progress, planned, completed) maps cleanly to your prioritization decisions. Move a request to "under review" when you're actively scoring it. "Approved" signals a commitment. "Planned" tells users what's coming next. Users see this progression in the widget inside your app, which cuts down on the "did they ignore me?" frustration that erodes user trust.
Pick a feature's free tier covers 1 project and 10 active requests: enough to build your first prioritization dataset. The Starter plan is $5/month for 3 projects and unlimited requests. That's less than 1/15th of Canny's $79/month entry tier, with a Flutter-native widget you drop in with one line of code.
Frequently Asked Questions
How many feature requests should I score at once?
Score your top 20 to 30 requests per quarter. Reviewing the entire backlog is rarely worth the time: the bottom rarely surfaces anything actionable, and those hours are better spent building. Focus on your top candidates after a quick triage pass, and revisit the rest next cycle.
Should I always build the highest-voted feature?
Vote count feeds Reach, which is one of four RICE inputs. A 50-vote feature that ships in a week can beat a 200-vote feature that takes 4 months. RICE makes that trade-off visible. Use votes as input, not as the decision.
What if two features have almost the same RICE score?
Use Kano as a tiebreaker. If one is a Must-have and the other is a Delighter, build the Must-have first. If both are Performance features, go with whichever has higher Confidence in the Impact estimate, since inflated guesses tend to overstate scores on underresearched items.
How often should I reprioritize?
Monthly lightweight reviews, quarterly full rescoring. Between sessions, watch for requests that climb quickly in vote count. Fast-growing votes often signal emerging pain that wasn't on your radar when you last scored.
What if I don't have enough users to get reliable vote data yet?
Set Confidence lower when working with sparse data. A 30-user beta with 5 votes on a request probably warrants 50% Confidence, which the RICE formula discounts automatically. This surfaces uncertainty instead of hiding it behind a raw vote number.
Prioritize With a System, Not a Hunch
The best prioritization process is one you'll actually run consistently. RICE plus Kano fits in a spreadsheet, takes 30 minutes per week, and produces decisions you can defend to users and teammates.
RICE tells you what's worth the effort. Kano tells you what kind of value it creates. Stack those on top of vote data from inside your app and you've got a prioritization loop that scales from your first 100 users to 10,000.
If you want vote counts feeding directly into your RICE calculations, pick a feature gives you that inside your Flutter app. Start free at pickafeature.com and have a live feature request board running in under an hour.